cdepart
Tuesday, March 1, 2011
Cartographic Animation
link
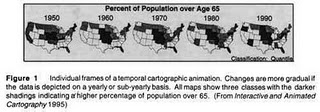
Cartographic animations display change in some aspect over time. They do this by having multiple maps that depict the changing information over time. This map shows the percentage of the population that is over the age 65.
No comments:
Post a Comment
Newer Post
Older Post
Home
Subscribe to:
Post Comments (Atom)
No comments:
Post a Comment