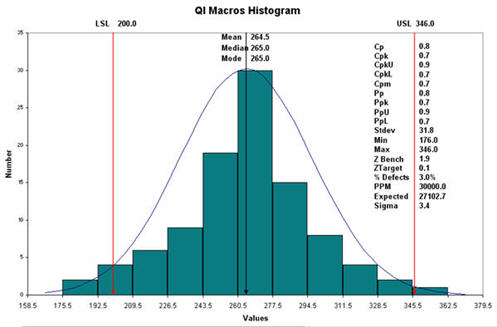
A histogram is a visual representation of the distribution of data. The more times that a variable comes up the higher that the bar for that variable will be. As this Histogram shows, this is extremely useful in business and in this example used to predict sales.
link
No comments:
Post a Comment