cdepart
Friday, April 15, 2011
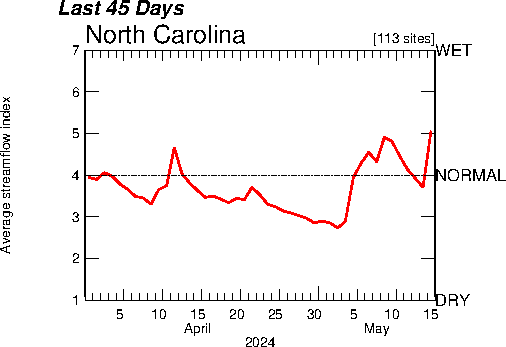
Index value plot
An index value plot map is a type of visualization map. It is when a line graph has an index value plotted on it This shows the precipitation in North Carolina for January, February, and March.
link
No comments:
Post a Comment
Newer Post
Older Post
Home
Subscribe to:
Post Comments (Atom)

No comments:
Post a Comment