Wednesday, April 6, 2011
Isotachs Map
An isotachs map is also like a topographic map but it connects the wind speeds that are the same. Weather forecasters use this map a lot to show what is on its way to an area. link
Isobar Map
An Isobar map is very similar to a topographic map but instead of lines connecting the same elevation an isobar is a line that connects equal atmospheric pressures. This isobar map is of a region in New Zealand. link
Tuesday, March 1, 2011
Doppler Radar Map
link Doppler radars work by sending out beams and then recording how much of the beam returns back. If the beam returns back then it means that it was reflected by rain or snow or some kind of precipitation. These maps are used a lot by weather stations to predict where a storm is going.
Black and White Aerial Photo Map
link Black and white aerial photo maps are simply an aerial view of a certain area that is in black and white. This is an aerial black and white photo of Bloomsburg.
Infrared Aerial Photo
Infrared aerial photo maps use infrared technology to distinguish between different things like ecosystems and rivers. The infrared distinguishes thing by picking up the different temperatures of different things.
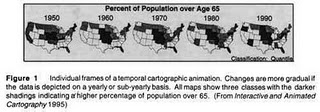
Cartographic Animation
link Cartographic animations display change in some aspect over time. They do this by having multiple maps that depict the changing information over time. This map shows the percentage of the population that is over the age 65.
Subscribe to:
Posts (Atom)